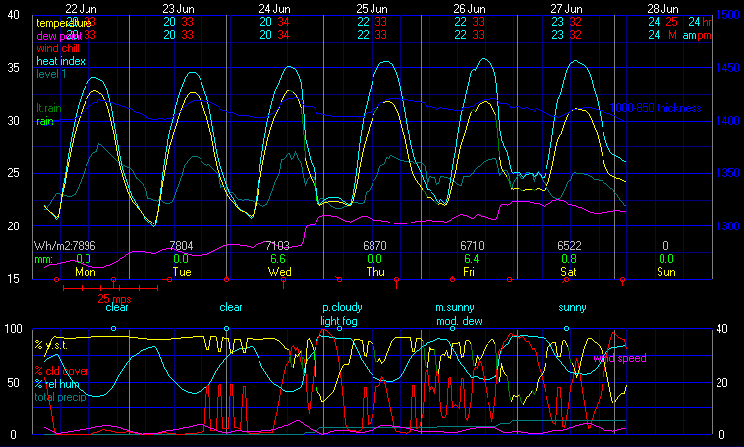
Ερμηνεία Γραφήματος
Ανω μέρος Γραφήματος (Θερμοκρασίες °C)
| Temp |
Οι Θερμοκρασίες "24ώρου", είναι οι μέγιστες και ελάχιστες θερμοκρασίες απο μεσάνυχτα σε μεσάνυχτα.
|
|
Οι Θερμοκρασίες ΠΜ/ΜΜ ορίζονται ως εξής: Η ελάχιστη είναι από τις 7ΜΜ της προηγούμενης μέρας μέχρι τις 7ΠΜ της τρέχουσας μέρας. Η μέγιστη ορίζεται από τις 7ΠΜ μέχρι τις 7ΜΜ της τρέχουσας μέρας.
Συνήθως, οι δύο τύποι αναφορών έχουν το ίδιο αποτέλεσμα, αλλά κατά τη διάρκεια του χειμώνα, όπου τα μέτωπα διασχίζουν την περιοχή, παρατηρούνται διαφορές. Οι προγνώσεις της ΕΜΥ ακολουθούν το σύστημα ΠΜ/ΜΜ (όπως κι αυτές οι προγνώσεις), αλλά τα επίσημα κλιματικά δεδομένα καταγράφονται από μεσάνυχτα σε μεσάνυχτα. |
| Dew Pt |
Είναι η θερμοκρασία όπου ο αέρας δεν μπορεί να συγκρατήσει όλη την υγρασία του.
|
|
Το Σημείο Δρόσου είναι καλύτερη ένδειξη σε σχέση με την Υγρασία για το πόσο αποπνικτικά η ξηρά αισθάνεται κάποιος.
|
| Wet Bulb |
Η θερμοκρασία αυτή είναι η χαμηλότερη θερμοκρασία που μπορεί να επιτευχθεί με την εξάτμιση του νερού.
|
|
Είναι η θερμοκρασία που αισθάνεστε όταν το δέρμα σας είναι υγρό και εκτίθεται στην κίνηση του αέρα.
Η Θερμοκρασία Υγρού Βολβού είναι μια ένδειξη του ποσού της υγρασίας στον αέρα. |
| 850 hPa |
Η θερμοκρασία αυτή δείχνει τις συνθήκες στα 5000 περίπου πόδια (1450 μ.) πάνω από την επιφάνεια της θάλασσας.
|
|
Υπάρχει μια τάση στο ότι η θερμοκρασία θα είναι υψηλότερη από την προβλεπόμενη τις ημέρες που ο άνεμος θα είναι ασθενής και χαμηλότερη από την προβλεπόμενη τις ημέρες που ο άνεμος θα είναι ισχυρός. Αυτό συμβαίνει επειδή ο άνεμος στο χαμηλό επίπεδο επηρεάζει το μέγεθος της ανάμειξης.
Δεν λειτουργεί σε συννεφιασμένες ημέρες ή ημέρες με απογευματινό υετό.
|
| Temp Adv |
Αναφέρεται σε αλλαγές της θερμοκρασίας που προκαλούνται από τη μετακίνηση του αέρα με τον άνεμο.
|
|
Η πρόγνωση Θερμοκρασιών χρησιμοποιώντας την Οριζόντια Μεταφορά συμπεριλαμβάνει την κατεύθυνση του ανέμου στην τοποθεσία του σταθμού και τη ροή των θερμοκρασιών (από την κατεύθυνση που φυσά ο άνεμος). Αν η θερμοκρασία είναι θερμότερη αυτό σημαίνει πως θερμότερος αέρας μεταφέρεται προς το σταθμό και η θερμοκρασία θα ανεβεί. |
Κάτω μέρος Γραφήματος (Δείκτες Αστάθειας)
| Θετικό νούμερο |
Σταθερό |
| 0 εως -4 |
Ελάχιστη αστάθεια |
| -4 εως -7 |
Μεγάλη αστάθεια |
| -8 ή μικρότερο |
Ακραία αστάθεια |
|
Ο δείκτης LI χρησιμοποιείται για την εκτίμηση της αστάθειας στο χαμηλό επίπεδο της τροπόσφαιρας.
Οσο πιο αρνητική είναι η τιμή του LI τόσο πιο ασταθής είναι η τροπόσφαιρα και τόσο θα υπάρχει μεγαλύτερη επιτάχυνση για ανυψούμενα πακέτα αέρα από το PBL (Πλανητικό Οριακό Στρώμα).
Ο LI χρησιμοποιείται μόνο για τη μεταφορά στη θερμή περίοδο. Δε συνιστάται για την πρόγνωση υετού το χειμώνα.
Ο LI αξιολογεί αστάθεια μόνο σε ένα επίπεδο της τροπόσφαιρας. |
| 15-25 |
Μικρή δυναμική μεταφοράς |
| 26-39 |
Μέση δυναμική μεταφοράς |
| 40+ |
Υψηλή δυναμική μεταφοράς |
|
Ο δείκτης KI χρησιμοποιείται για εκτίμηση της δυναμικής μεταφοράς.
Δε θα πρέπει να χρησιμοποιείται για υπολογισμό της σφοδρότητας των καταιγίδων.
Αυτός ο δείκτης λειτουργεί καλύτερα σε επίπεδες περιοχές σε χαμηλά ή μεσαία υψόμετρα. Δε λειτουργεί σε μεγάλα υψόμετρα. Η εγκυρότητα της εκτίμησης διαφέρει από εποχή σε εποχή και από τόπο σε τόπο. |
| <44 |
Μικρή μεταφορά |
| 44-50 |
Πιθανές καταιγίδες |
| 51-52 |
Απομονωμένες
ισχυρές καταιγίδες |
| 53-56 |
Ευρέως διασκορπισμένες
έντονες καταιγίδες |
| >56 |
Διασκορπισμένες
έντονες καταιγίδες |
|
Ο δείκτης TT χρησιμοποιείται για εκτίμηση της ισχύος των καταιγίδων.
Αυτός ο δείκτης λειτουργεί καλύτερα σε επίπεδες περιοχές σε χαμηλά ή μεσαία υψόμετρα. Δε λειτουργεί σε μεγάλα υψόμετρα. Η εγκυρότητα της εκτίμησης διαφέρει από εποχή σε εποχή και από τόπο σε τόπο.
Ο δείκτης θα είναι πολύ σταθερός αν ένα στρώμα υγρασίας είναι ακριβώς κάτω από το επίπεδο των 850 hPa. |
| Θετικό νούμερο |
Σταθερό |
| 0 εως -4 |
Ελάχιστη αστάθεια |
| -4 εως -7 |
Μεγάλη αστάθεια |
| -8 ή μικρότερο |
Ακραία αστάθεια |
|
Ο δείκτης SI χρησιμοποιείται για την εκτίμηση της αστάθειας στο επίπεδο των 850 hPa.
Οσο πιο αρνητική είναι η τιμή του SI τόσο πιο ασταθής είναι η τροπόσφαιρα και τόσο θα υπάρχει μεγαλύτερη επιτάχυνση για ανυψούμενα πακέτα αέρα από το άνω PBL (Πλανητικό Οριακό Στρώμα).
Ο SI είναι χρησιμότατος όταν υπάρχει ένα ρηχό στρώμα πολικού αέρα σε χαμηλό επίπεδο στο PBL. Σε αυτή τη περίπτωση, η ανύψωση θα εμφανιστεί πάνω από τον πολικό αέρα. Ετσι ο SI είναι πολύ πιο σχετικός να αξιολογήσει σε σχέση με τον LI.
Ο SI αξιολογεί αστάθεια μόνο σε ένα επίπεδο της τροπόσφαιρας. |
|